
There is the age-old desire to discover where one fits in the world. In the pecking order, where does one fall? This impulse is nearly irresistible. One author at WAFT decided to succumb to this temptation and create a metric that compares the historic and continued dominance of the élite echelon of college hockey.
What makes other programs cast a jealous eye in the direction of others? What imbues loathing in the minds of opponents and their fanbases? Is it a history of dominance? Unquestionably, yes. Is it an absolute number of championships? Almost certainly no. That which inspires true reverence in the classical sense is historic and continued dominance that manifests itself in what seems disproportionate success.
Dominance in athletics, in essence, is a measure of how often a team wins something of consequence compared to how often that team should win if pure probability dictated. Franchises and programs are dominant when they win consistently more than is their "fair share" over extended periods of time. Each program in college hockey, since the admission of Alabama-Huntsville into the WCHA, is afforded the opportunity to compete for two things of consequence in post-season play: a conference and NCAA title.
Dominance Rating Model
This writer decided to limit this all-time analysis of the dominance of college-hockey programs to the NCAA era. Rivalrous claims to national titles and inadequate data from the pre-NCAA era undermine the legitimacy of using that era's statistics in direct historical comparisons. Therefore, the findings of this analysis are limited necessarily to college-hockey dominance since the first NCAA tournament in 1948.
The perceived "fair share" represents how often one would expect a program to win if results were random. Consider a hypothetical conference of four members. Each team would be expected to win every four years if unadulterated chance governed. However, if over eight years, one team won four titles, that team has won twice as often as it is expected. That team has won half of the championships awarded while representing a mere quarter of the membership. The factor of two by which this team has outperformed chance is a measure of that team's dominance.
A meaningful analysis of dominance must take into account changes over time. The seismic shifts in conference affiliation over the last three seasons have made this clear. Competing in the WCHA during the 2014-15 season is not the same as competing in the similarly named conference during the 2010-11 season. Hockey East now possesses 12 members when but a few seasons ago it counted a mere 10 programs as members. Both realities affect how likely a program is to win a league championship by chance. Furthermore, the legacy of a program like Union cannot be undercut for not winning NCAA national titles in eras when it had no program or was not competing at the appropriate level.
Consider again the above four-team conference and the eight years of championships. However, this time, imagine that the conference expanded to eight members after the fourth championship. Immediately, it becomes apparent that it matters when each championship was won. The team in question is expected to win more often competing in the four-member configuration than it is when it is a member of an eight-team conference. Assume that two titles were won in each configuration over the eight years. The number of titles won in the first iteration of the conference reflects the team's ability to outperform chance by a factor of two while the number won in the second iteration reflects an outperformance rate of four.
Using the increments of seasons and the incidental dominance value of number of championships that a particular team has won with respect to those awarded until that point, one creates a weighted system that can be averaged over those seasons to calculate the average degree of dominance that a college-hockey program has enjoyed throughout its existence.
Realignment and changing affiliations create other issues because they involve not only the change in the number of members within a conference, but also the number of years over which that championship has been awarded or for which a team has been competing for those championships. Therefore, after realignment, all teams rightly are considered to be competing for the first championship given and begin a new era of dominance calculations within their new cohort. Their dominance and success in previous conferences are still averaged and weighted over the existence of the program.
The dominance of new members is calculated relative to their date of entry. For example, Union's rate of winning in ECAC Hockey is calculated out of how many championships that they have won since they were eligible for ECAC Hockey's post-season in 1992, not since the conference's first postseason in 1962. This applies at the national level as well for programs that were later additions to the NCAA Division I level.
National dominance is easily calculated. The national dominance rating of a team at any given time is calculated as the numerator of the number of NCAA championships that it has won divided by the number of years over which that program has been eligible for the NCAA tournament divided by the divisor of the percentage of programs in NCAA Division I hockey that the program in question represents within a given season.
The above method yields an NCAA and conference rating of dominance. To allow more ready comparison, this writer scaled the respective ratings of NCAA and conference dominance to 100 points. Michigan exhibited the greatest NCAA dominance and its NCAA dominance rating was scaled to 100 points. Every other program's respective NCAA dominance rating was calculated proportionally from that base. The same was done with Wisconsin as the 100-point basis for calculating conference dominance.
Considering that NCAA dominance is valued more highly than conference dominance within college-hockey fandom, the all-time dominance rating given to each program weights a program's NCAA dominance rating twice as much as it does its conference dominance rating. The resulting all-time overall dominance ratings for each NCAA title-winning program are included at the top and bottom of this post. The related NCAA and conference dominance ratings are graphically represented.
The Rankings
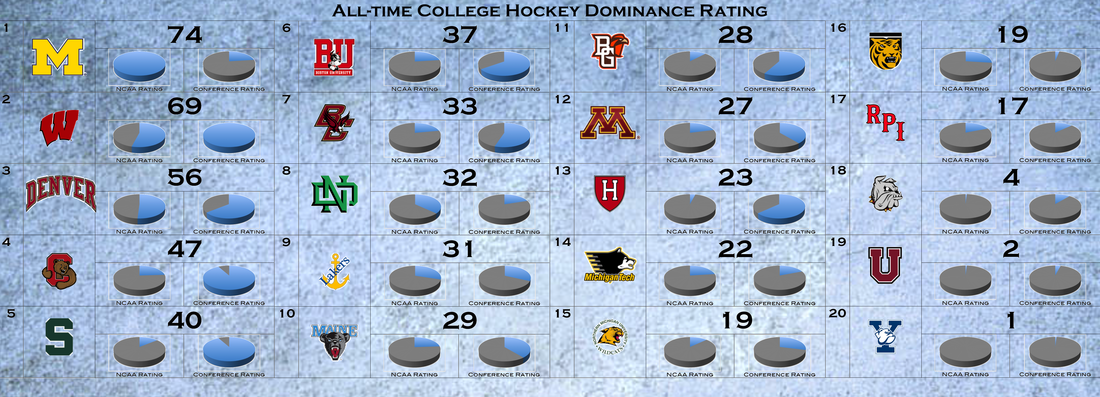
Some of the results are surprising, others are far from it. Despite middling historical dominance of its own conference, Michigan's winning of the first NCAA title and eight thereafter ensures that the Wolverines are the most dominant program in the history of college hockey. The maize and blue tumble from a possible perfect dominance rating of 100 to one of 74.
Wisconsin's consistent dominance over its conference peers, whether it is playing in the WCHA or winning the inaugural Big-Ten tournament, propels it to within striking distance of Michigan. The fact that Wisconsin with six NCAA titles outpaces Denver with its seven NCAA titles highlights how in unpredictable but yet sensical ways the dominance rating prioritizes success. This phenomenon is discussed more later.
Cornell owns the eighth-best NCAA dominance rating. However, it is the Big Red's historic and consistent dominance over its conference cohort that catapults the Ithacans from eighth place to fourth in the all-time dominance rating. Wisconsin is the only program that imposes more historic dominance over its conference than does Cornell.
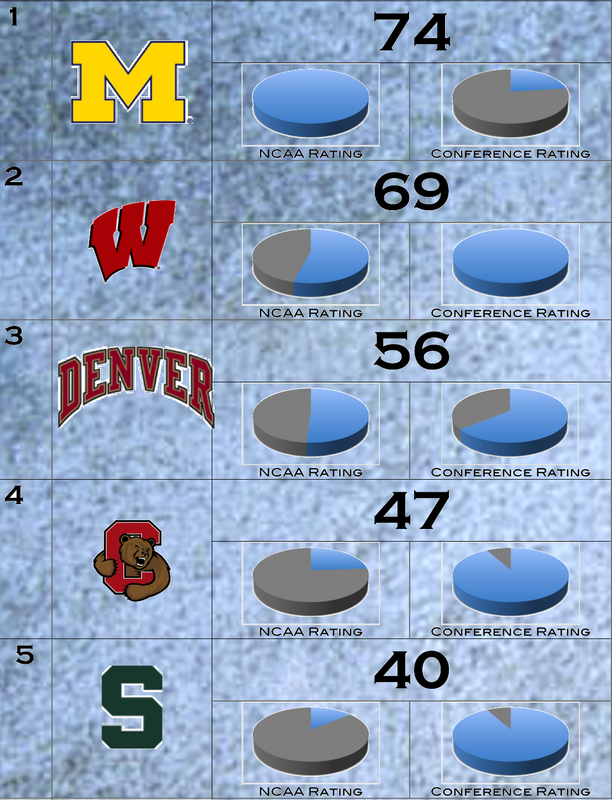
The programs that follow Cornell immediately have more NCAA titles than does Cornell. How does this make sense? The answer is twofold. Boston University and Michigan State were eligible for the NCAA tournament nearly a decade longer than was Cornell. The latter won an NCAA title a mere season before Cornell won its first. The former waited until four seasons after Cornell won its first crown. The extended period over which neither program won but was eligible is why Cornell is calculated to have the same dominance rating as both programs.
In essence, Boston University and Michigan State had all but fallen behind the rate of winning that chance would predict by the time that either won their first NCAA title. Boston College suffers from the 52-year period of not winning an NCAA championship. A similar drought factor pulls down Cornell's dominance rating somewhat, but an incredible dominance of ECAC Hockey counteracts part of this effect.
Boston University's conference dominance rating suffers from historically remaining only the second-most dominant in the two conferences in which it has been a member. In ECAC Hockey, the Terriers were second to Cornell. In Hockey East, Boston University trails behind the dominance of Boston College. The small size of Hockey East until recently exacerbates Boston University's need to outcompete its "fair share." However, the Terriers still edge out the Eagles because of their past second-most dominant status in ECAC Hockey.
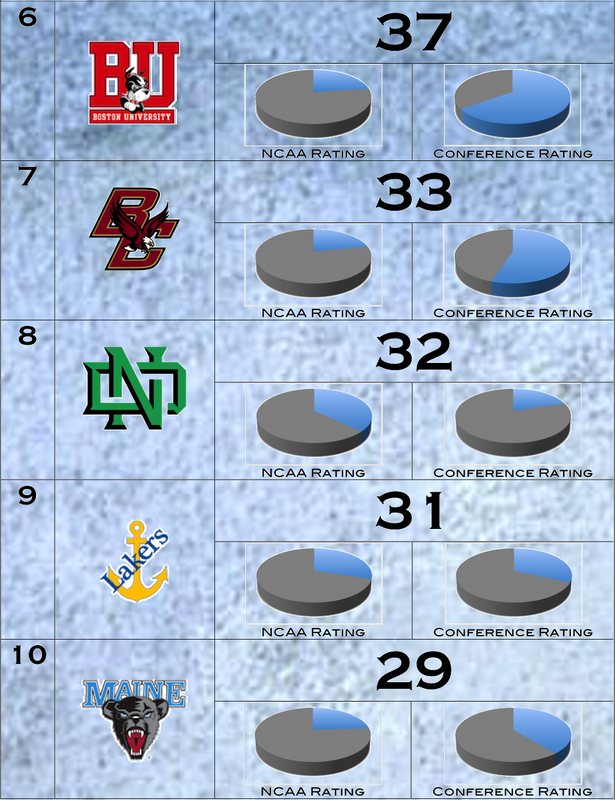
Most starkly, the dominance rating illustrates which programs of high esteem are clearly not programs of immense success in the playoffs. The Golden Gophers of Minnesota clock in at a disappointing 12th ranking. Playing in the historically modestly sized WCHA and exhausting 24 seasons before winning its first NCAA title, Minnesota outperforms, but just barely, its "fair share" over time.
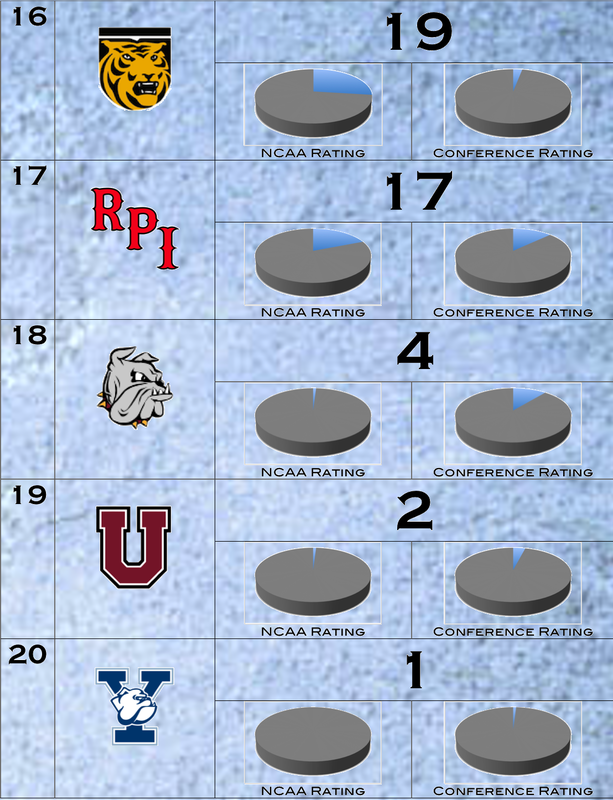
The examples of Boston University, Michigan State, and Minnesota need not undermine this model as valuing early success too highly. One only needs to regard Colorado College to allay these fears. The Tigers won the third and tenth NCAA tournaments. They have been eligible for all such tournaments. Colorado College ranks 16th all-time in dominance far behind all three more recent winners.
It is interesting to note that eight NCAA title-winning programs historically have averaged winning their conference less often than random chance would predict. Those programs are Michigan, North Dakota, Michigan Tech, Colorado College, RPI, Minnesota-Duluth, Union, and Yale. Five programs are relatively more dominant on the national scale than they have been within their associated conferences. Those programs are Michigan, North Dakota, Michigan Tech, Colorado College, and RPI.
Some will disagree with these findings. The interesting result is how this model captures some of the subconscious assumptions of college-hockey fans. It quantifies why many fans give Cornell greater respect as a program than they do programs of greater absolute numbers of NCAA titles like Michigan State, Lake Superior State, or Michigan Tech.
Yes, it is true that programs of greater numbers of NCAA titles may slide up or down relative to this dominance rating model in terms of social cache that they actually enjoy. The model nonetheless stratifies college hockey into relatable and reasonable bands. The dominance rating serves as one means to determine which programs are the greatest in the great sport of college hockey over periods of great change. The conclusions of this model can be understood to indicate which programs have been the most consistently dominant in the minds of the greatest number of generations of fans.
Wisconsin's consistent dominance over its conference peers, whether it is playing in the WCHA or winning the inaugural Big-Ten tournament, propels it to within striking distance of Michigan. The fact that Wisconsin with six NCAA titles outpaces Denver with its seven NCAA titles highlights how in unpredictable but yet sensical ways the dominance rating prioritizes success. This phenomenon is discussed more later.
Cornell owns the eighth-best NCAA dominance rating. However, it is the Big Red's historic and consistent dominance over its conference cohort that catapults the Ithacans from eighth place to fourth in the all-time dominance rating. Wisconsin is the only program that imposes more historic dominance over its conference than does Cornell.
The programs that follow Cornell immediately have more NCAA titles than does Cornell. How does this make sense? The answer is twofold. Boston University and Michigan State were eligible for the NCAA tournament nearly a decade longer than was Cornell. The latter won an NCAA title a mere season before Cornell won its first. The former waited until four seasons after Cornell won its first crown. The extended period over which neither program won but was eligible is why Cornell is calculated to have the same dominance rating as both programs.
In essence, Boston University and Michigan State had all but fallen behind the rate of winning that chance would predict by the time that either won their first NCAA title. Boston College suffers from the 52-year period of not winning an NCAA championship. A similar drought factor pulls down Cornell's dominance rating somewhat, but an incredible dominance of ECAC Hockey counteracts part of this effect.
Boston University's conference dominance rating suffers from historically remaining only the second-most dominant in the two conferences in which it has been a member. In ECAC Hockey, the Terriers were second to Cornell. In Hockey East, Boston University trails behind the dominance of Boston College. The small size of Hockey East until recently exacerbates Boston University's need to outcompete its "fair share." However, the Terriers still edge out the Eagles because of their past second-most dominant status in ECAC Hockey.
Most starkly, the dominance rating illustrates which programs of high esteem are clearly not programs of immense success in the playoffs. The Golden Gophers of Minnesota clock in at a disappointing 12th ranking. Playing in the historically modestly sized WCHA and exhausting 24 seasons before winning its first NCAA title, Minnesota outperforms, but just barely, its "fair share" over time.
The examples of Boston University, Michigan State, and Minnesota need not undermine this model as valuing early success too highly. One only needs to regard Colorado College to allay these fears. The Tigers won the third and tenth NCAA tournaments. They have been eligible for all such tournaments. Colorado College ranks 16th all-time in dominance far behind all three more recent winners.
It is interesting to note that eight NCAA title-winning programs historically have averaged winning their conference less often than random chance would predict. Those programs are Michigan, North Dakota, Michigan Tech, Colorado College, RPI, Minnesota-Duluth, Union, and Yale. Five programs are relatively more dominant on the national scale than they have been within their associated conferences. Those programs are Michigan, North Dakota, Michigan Tech, Colorado College, and RPI.
Some will disagree with these findings. The interesting result is how this model captures some of the subconscious assumptions of college-hockey fans. It quantifies why many fans give Cornell greater respect as a program than they do programs of greater absolute numbers of NCAA titles like Michigan State, Lake Superior State, or Michigan Tech.
Yes, it is true that programs of greater numbers of NCAA titles may slide up or down relative to this dominance rating model in terms of social cache that they actually enjoy. The model nonetheless stratifies college hockey into relatable and reasonable bands. The dominance rating serves as one means to determine which programs are the greatest in the great sport of college hockey over periods of great change. The conclusions of this model can be understood to indicate which programs have been the most consistently dominant in the minds of the greatest number of generations of fans.
| 
| 
| 
|


 RSS Feed
